Unlocking Data Manipulation in JupyterLab with Mito: A Guide
Written on
Introduction to Mito
Mito is a JupyterLab extension that streamlines data manipulation without requiring any coding. This interactive tool allows users to handle data effortlessly, making it particularly useful for those working with real-world datasets. For example, if you’ve spent hours cleaning and organizing data using Python libraries like Pandas, Mito offers a refreshing alternative. With Mito, tasks such as importing datasets, filtering data, creating pivot tables, and eliminating duplicates become intuitive and quick.

Getting Started with Mito
To begin using Mito, you need to ensure that Python 3.6 or a newer version is installed, along with the JupyterLab environment. Once these prerequisites are met, launch JupyterLab in your web browser and execute the following commands in a new terminal to install Mito:
python -m pip install mitoinstaller
python -m mitoinstaller install
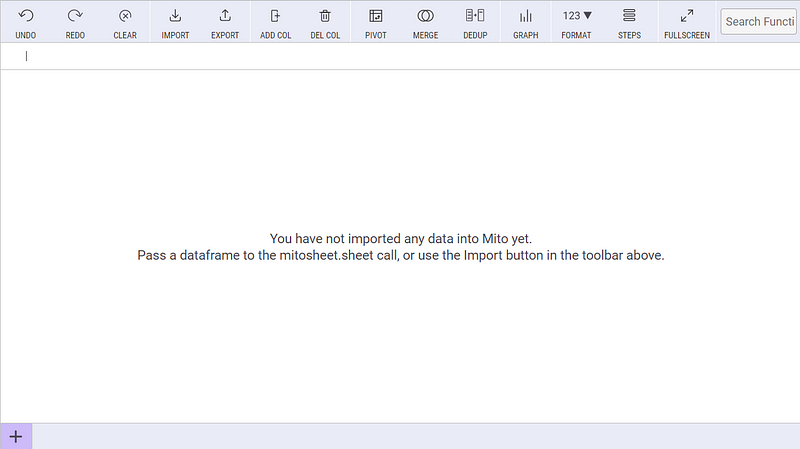
After restarting the Kernel, you can start exploring this powerful package. To verify that Mito is functioning correctly, create a new notebook and run:
import mitosheet
mitosheet.sheet()
Overview of Mito Features
Let’s dive into Mito by importing two datasets: time_series_covid19_vaccine_global.csv and world_pop_by_country.csv, both sourced from the Johns Hopkins University’s Coronavirus Resource Center GitHub repository. Upon loading these datasets, Mito automatically generates the corresponding Python code.
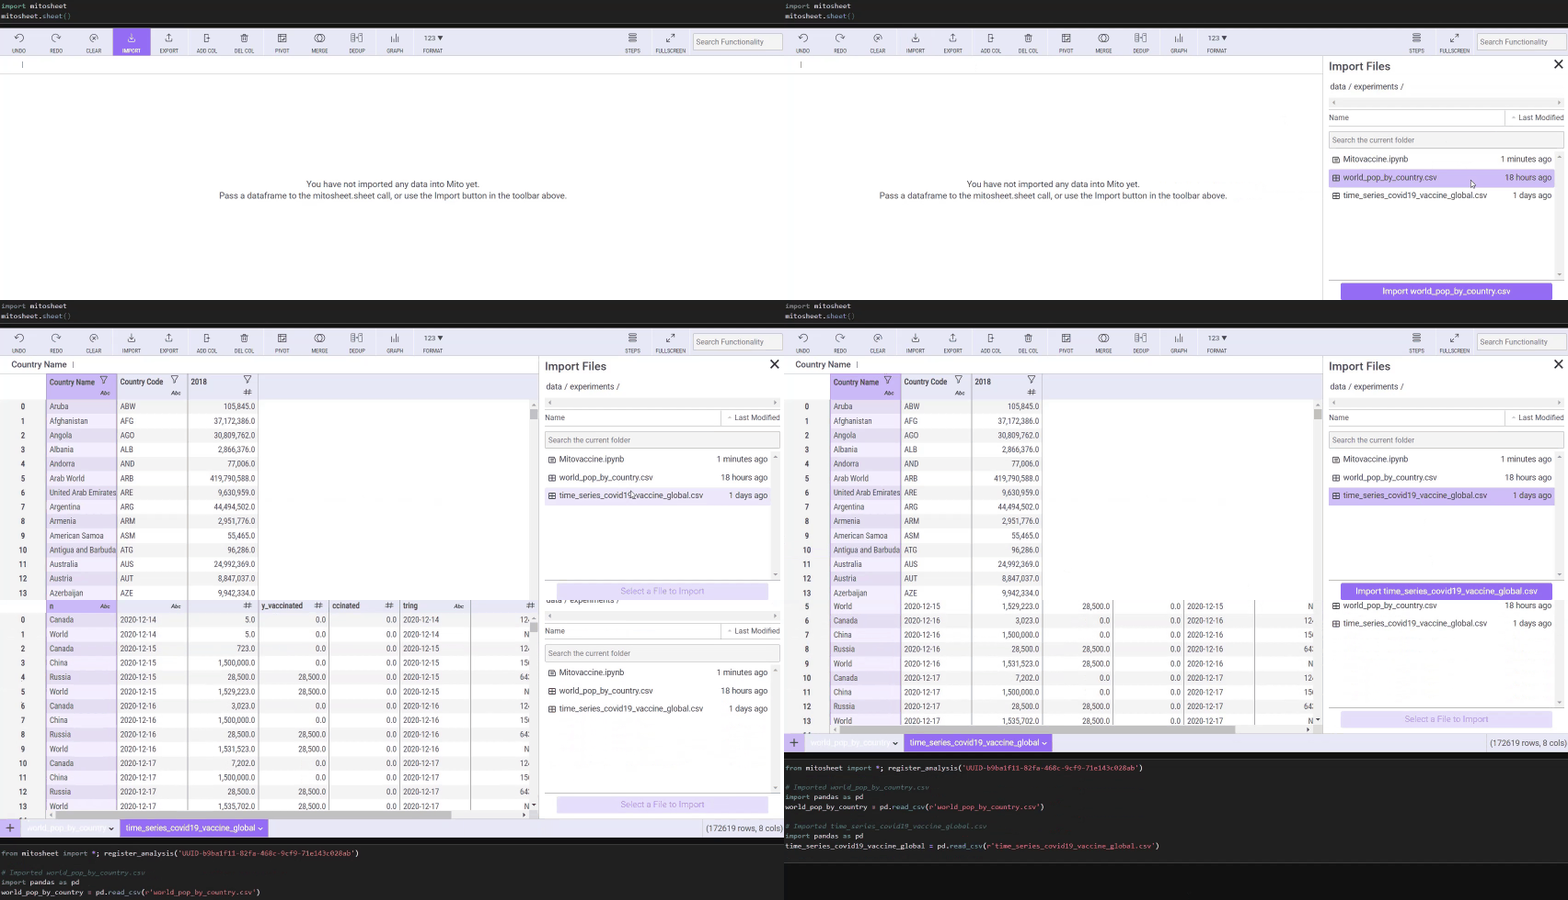
The interface includes a menu bar with essential functionalities such as:
- Import: Load datasets from your file system.
- Add/Delete Column: Modify your dataset structure.
- Undo: Revert the last changes made.
- Pivot: Group and aggregate data effortlessly.
- Merge: Combine two tables seamlessly.
- Dedup: Remove duplicate entries.
- Graph: Visualize data trends.
In this guide, we will explore specific operations: changing data types, sorting and filtering, adding and deleting columns, merging tables, creating pivot tables, and visualizing plots.
Data Analysis in Python for Excel Users (ft. Mito): This video provides insights into how Mito can enhance data analysis for users familiar with Excel.
Data Manipulation Operations
Change Data Type, Sort, and Filter
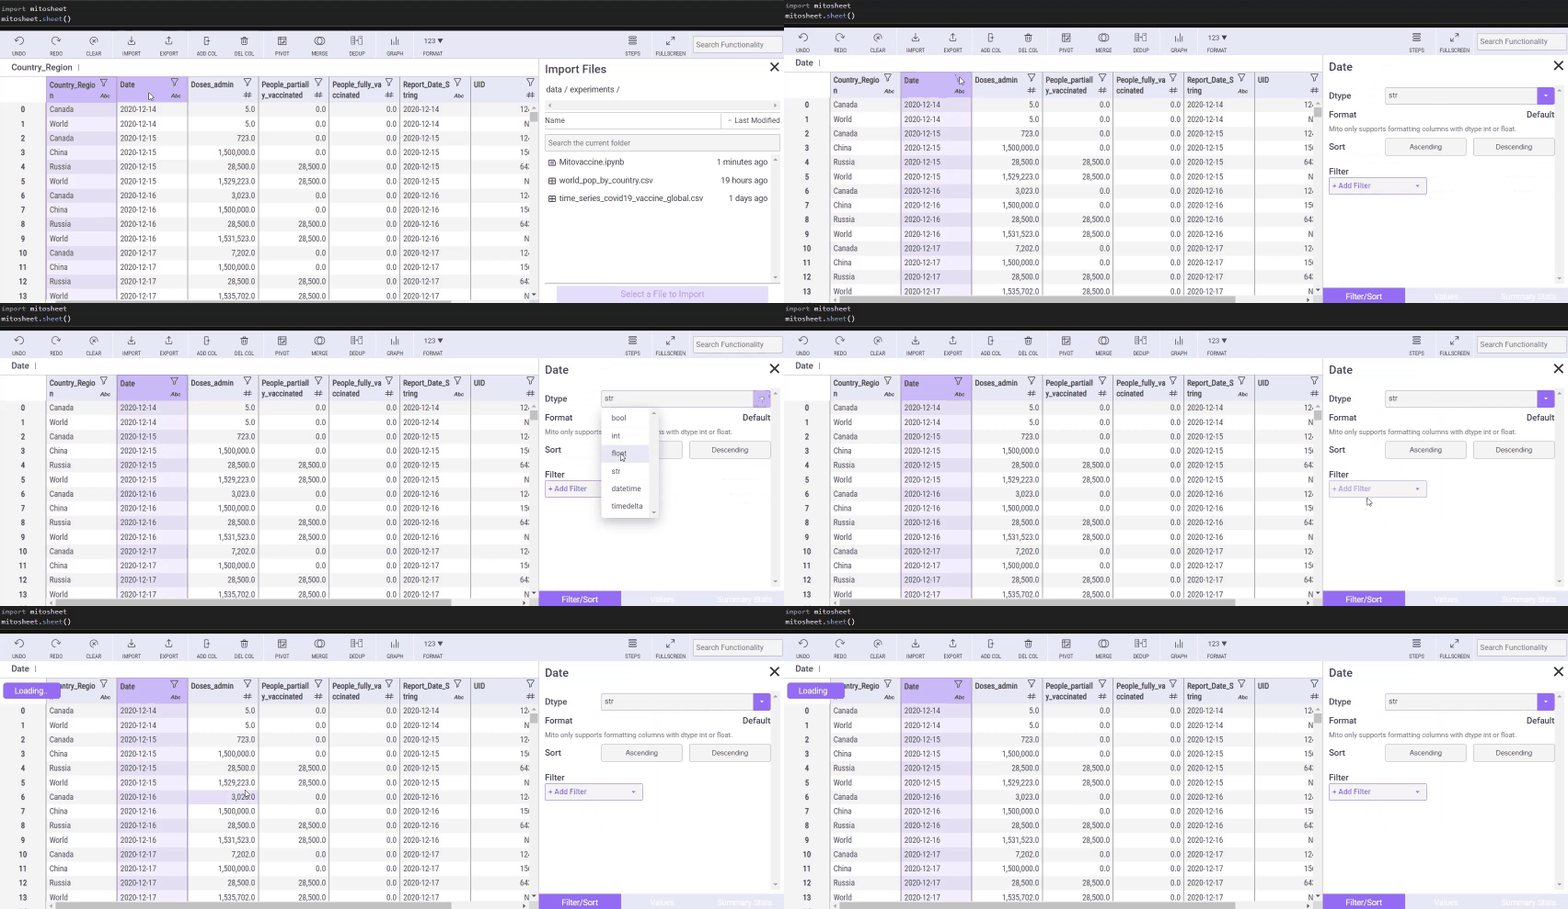
The first operation we’ll cover is changing the data type of columns. For instance, converting the Date column is now a quick task in Mito:
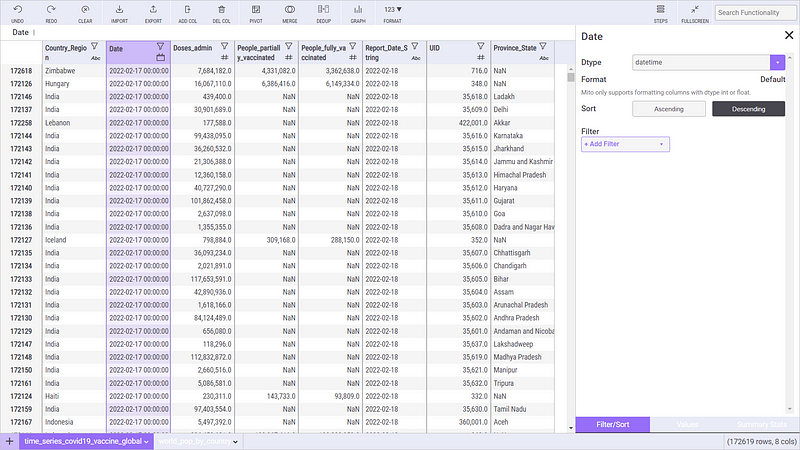
Sorting the Date column in descending order allows for easy analysis of recent data:
Additionally, filters can be applied to narrow down analyses to specific regions or countries:
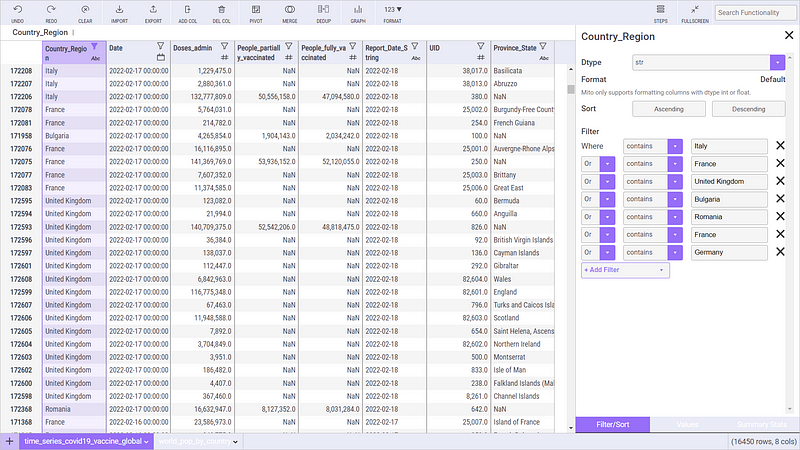
The code generated for these operations is straightforward and adds significant efficiency to your workflow.
Add and Delete Columns
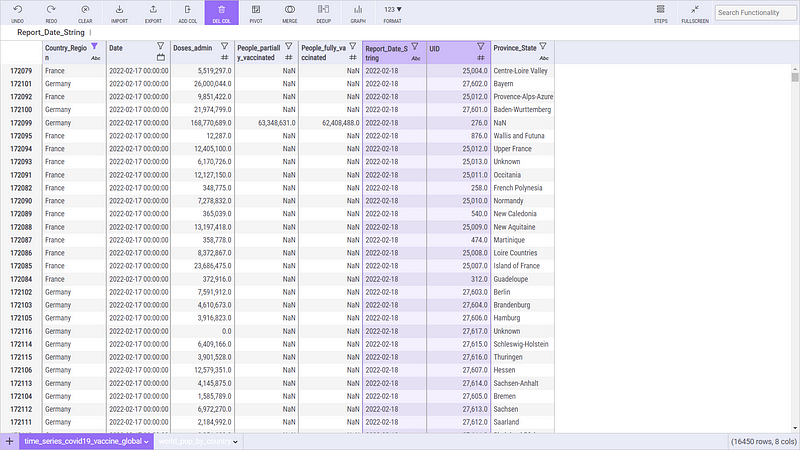
Adding or removing columns is intuitive; simply select the column and click “DEL COL” to remove it. You can also create new columns based on existing data, such as Year and Month derived from the Date field.
Merge Tables
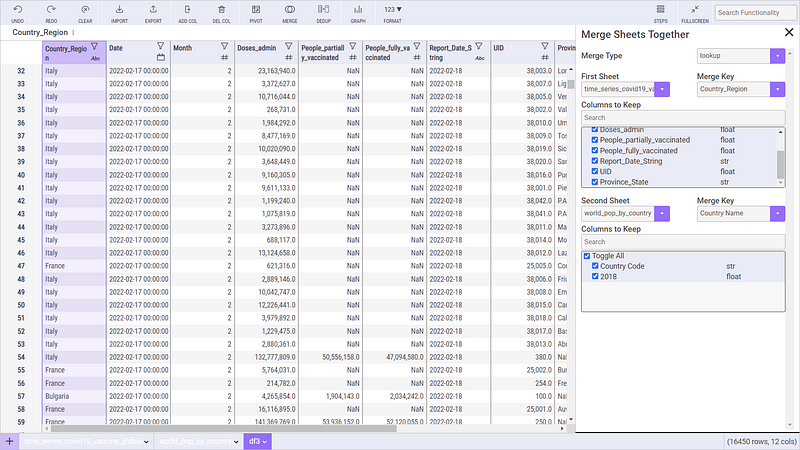
Merging tables is essential for a comprehensive analysis. By integrating world_pop_by_country.csv, we can enhance our understanding of the vaccination data.
Pivot Tables
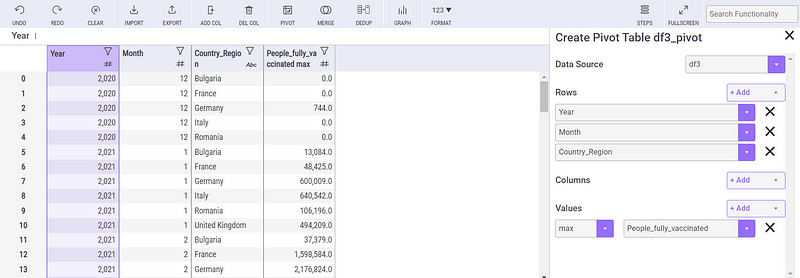
Mito simplifies the process of creating pivot tables, allowing users to visualize the number of fully vaccinated individuals by year, month, and country without the cumbersome coding typically required.
Visualize Plots
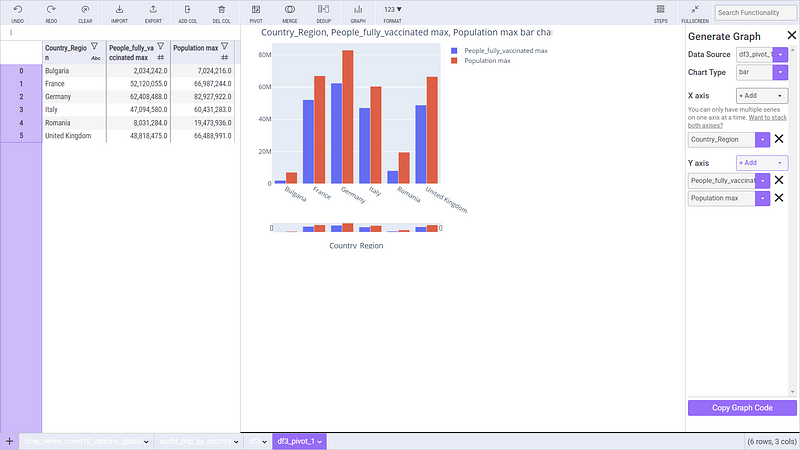
Finally, Mito enables users to generate graphs based on the pivoted data to gain insights into vaccination trends.
Setting up Plotly Dash in JupyterLab & Jupyter Notebook: This video walks you through the setup process for creating interactive visualizations in JupyterLab.
Conclusion
This tutorial highlights how Mito can drastically improve your workflow when dealing with real datasets, particularly in cleaning and analyzing data. The COVID-19 dataset serves as a practical example of Mito’s capabilities in data manipulation and visualization. With Mito, you can streamline your data analysis processes and focus more on deriving insights rather than coding.
For more detailed guides and tutorials on data science, consider exploring related articles.
References:
Disclaimer: This dataset is licensed under the Creative Commons Attribution 4.0 International (CC BY 4.0) by Johns Hopkins University on behalf of its Center for Systems Science in Engineering. Copyright Johns Hopkins University 2020.