Exploring Equations Through Visual Representation
Written on
Chapter 1: Understanding Equations Visually
To effectively grasp the concept of equations, it's beneficial to approach them visually. An equation serves as a connection between different quantities and can be expressed in various forms.
Before diving into this visual exploration, it's crucial to set aside traditional methods you may have learned in the past. This article introduces a fresh perspective on equations.
In our educational journeys, we often viewed equations as analogous to a balanced scale. To maintain equilibrium, adding a value on one side necessitates adding the same value on the other. This principle applies to various operations as well.
For instance, consider the equation a + b = c, where a, b, and c represent arbitrary numbers. This relationship can be illustrated in multiple ways:
- a + b = c
- a = c - b
- b = c - a
It’s noteworthy that both a and b exhibit a symmetrical relationship, allowing them to be interchanged without altering the overall equation's truth. However, this symmetry does not extend to swapping a and c.
So, is there a method to visually showcase this symmetry along with all representations? Indeed, there is!
Section 1.1: Visualizing Equations
Mathematical graphs can serve as a powerful tool in this context. A graph is composed of nodes (representing numbers) and edges (representing the operations linking them). For example, platforms like Facebook can be perceived as extensive graphs where individuals are nodes and friendships are edges.
In our equation-graph, the nodes will represent numbers, and the edges will signify operations between those numbers. This encapsulates all representations within a single structure.
Let's introduce a new notation by examining the graph (which can be visualized as a triangle) that represents the equation a + b = c.
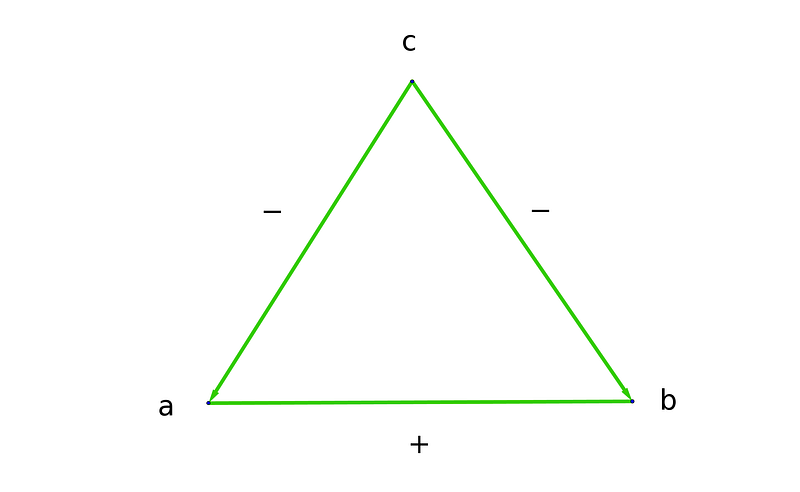
Notice that the edges stemming from c are directed arrows pointing towards a and b, which highlights the asymmetries among the numbers. We can term this an "additive graph."
How do we interpret this graph?
Following the edges between nodes reveals that the corresponding sum or difference relates to the remaining number. For example, tracing the edge from c to a indicates that c - a = b, while following the edge from c to b indicates c - b = a. Meanwhile, tracing the edge connecting a and b (in either direction) confirms a + b = c.
This approach can serve as an effective mnemonic for teaching students how to solve equations.
Section 1.2: Complex Equations and Graphs
What if both sides of the equation consist of operations? Let’s analyze the equation a + b = c + d.
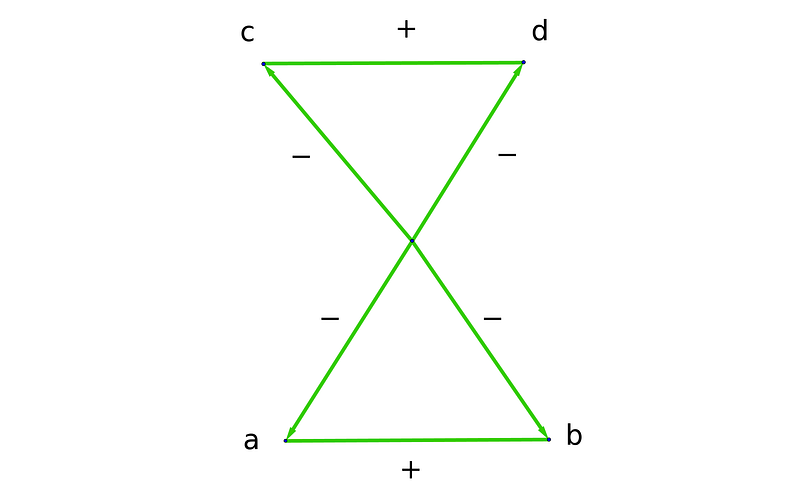
The empty node in the center symbolizes the sum of a + b, and tracing an edge to the number d indicates that a + b - d = c.
Next, we can explore multiplicative relationships in a similar manner. For the equation a ? b = c, we have three representations:
- a ? b = c
- a = c / b
- b = c / a
Let’s represent these relationships with the following graph.
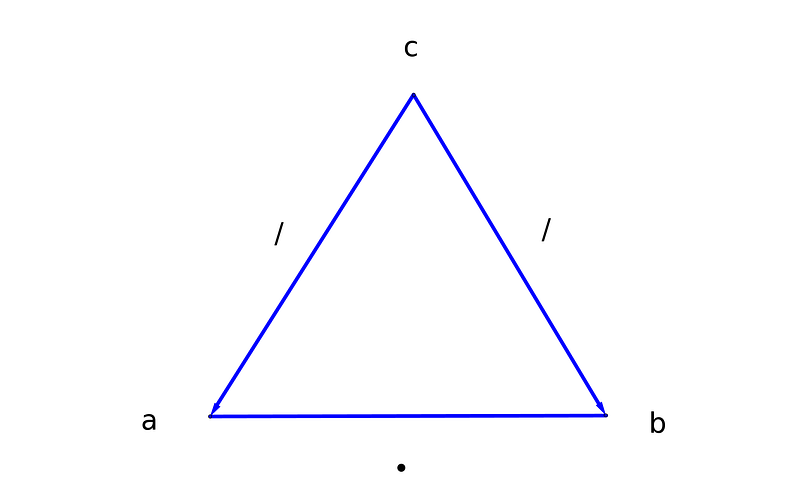
The rules remain consistent: following an edge will reveal the calculation associated with the remaining node.
Chapter 2: Solving Equations and Identifying Patterns
Now, let’s apply this visual framework to solve for x in the equation ax + b = y.
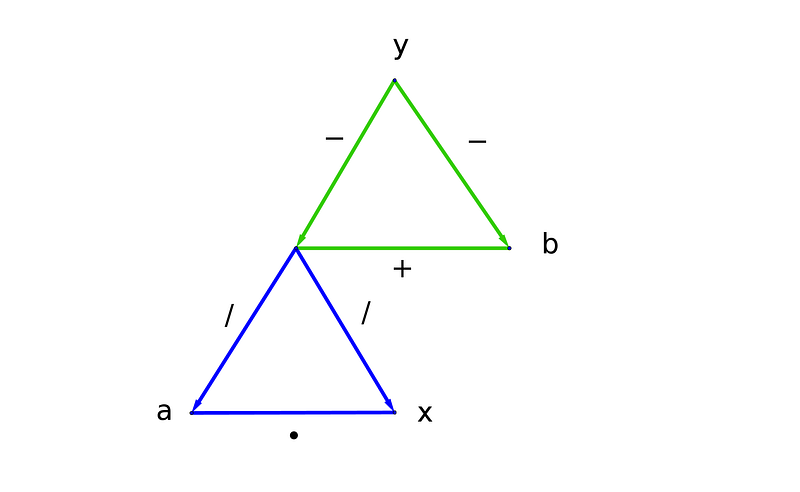
Here, the value of ax (represented by the unlabeled vertex at the top of the multiplicative triangle) combined with b results in y.
By navigating the graph, we can determine the value of x directly:
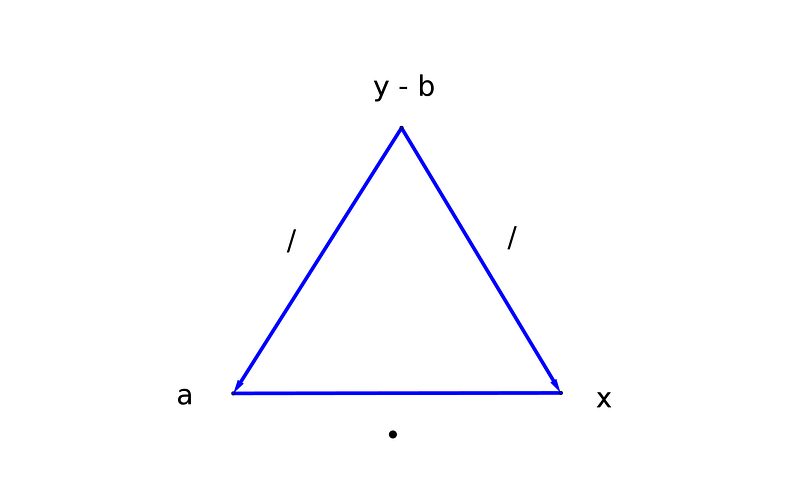
From this triangle, we find x = (y - b) / a.
Understanding Arithmetic Rules
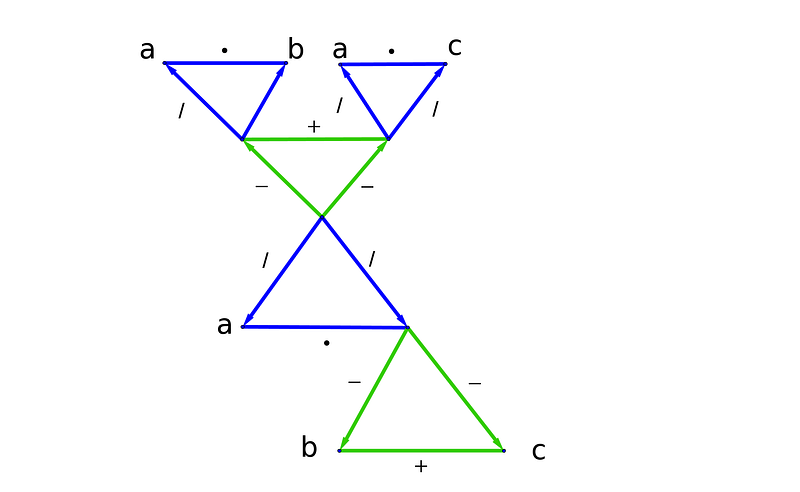
Familiarity with fundamental arithmetic laws is essential for effectively navigating this triangle universe. For instance, the associative law can be represented as follows:
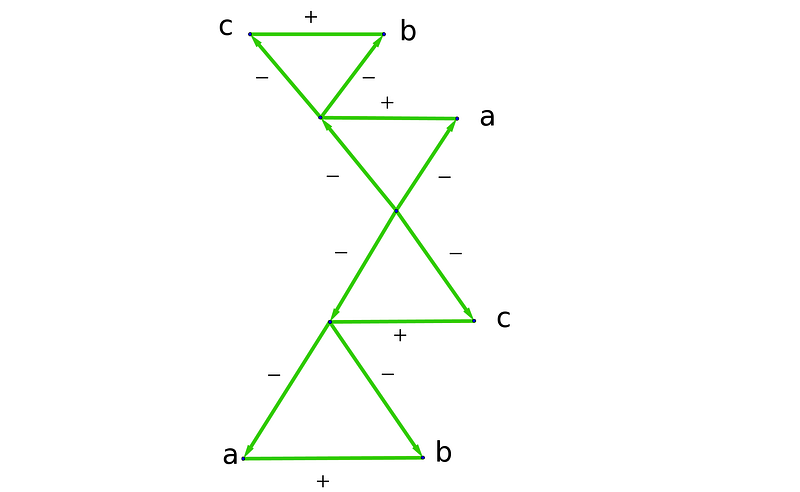
Similarly, the distributive law can be illustrated as:
Exploring Fraction Rules
What happens when we swap two numbers in an asymmetrical relationship? Let’s analyze the “a + b = c” triangle.
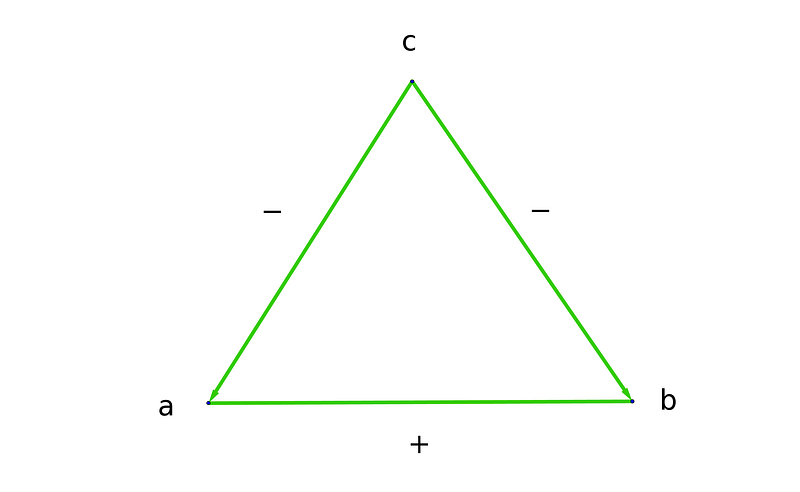
Swapping a and c would invalidate the equation; however, substituting b with its inverse (-b) maintains the correct relationship.
By comparing the two triangles, we observe:
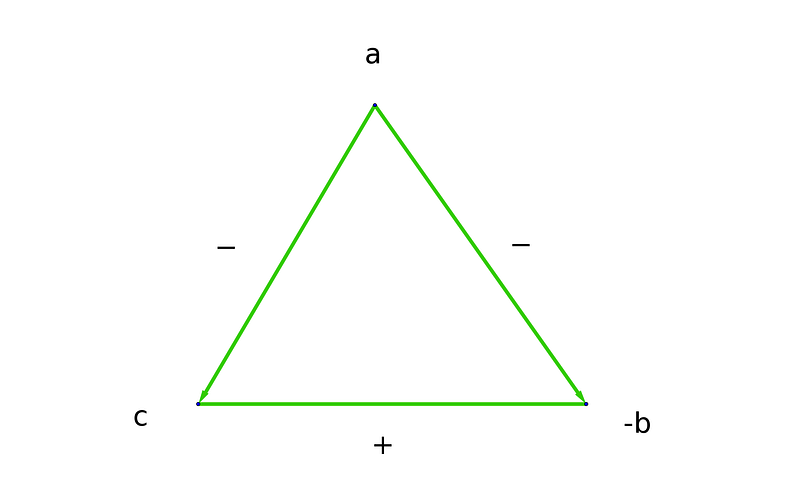
This illustrates the antisymmetry that also exists within the multiplicative triangle.
As we delve deeper into these visual methods for solving equations, numerous intriguing patterns await exploration. I encourage you to continue this journey of discovery.
For further exploration, we will tackle exponentiation in the next article, focusing on the connections between powers, roots, and logarithms.
The first video, "Expressions Map - Visualizing Algebra," delves into how visual tools can enhance the understanding of algebraic expressions.
The second video, "The Power of a Mathematical Picture," illustrates the significance of visual representations in mathematics, making complex concepts more accessible.